LOAD ARENA / SAMPLE RESULTS
SIMULATION POST-PROCESSING
Load Arena
One workflow for statistics, extreme loads, fatigue analysis, and result exploration.
I combine engineering knowledge, Python development, and data analysis to solve practical problems.
One workflow for statistics, extreme loads, fatigue analysis, and result exploration.
Explore wind measurements across heights, turbulence, vertical shear, and agreement between instruments.
A Python tool for estimating wind turbine blade loads during early design, when running full aeroelastic simulations for every design change can slow down development.
Developed in Python.
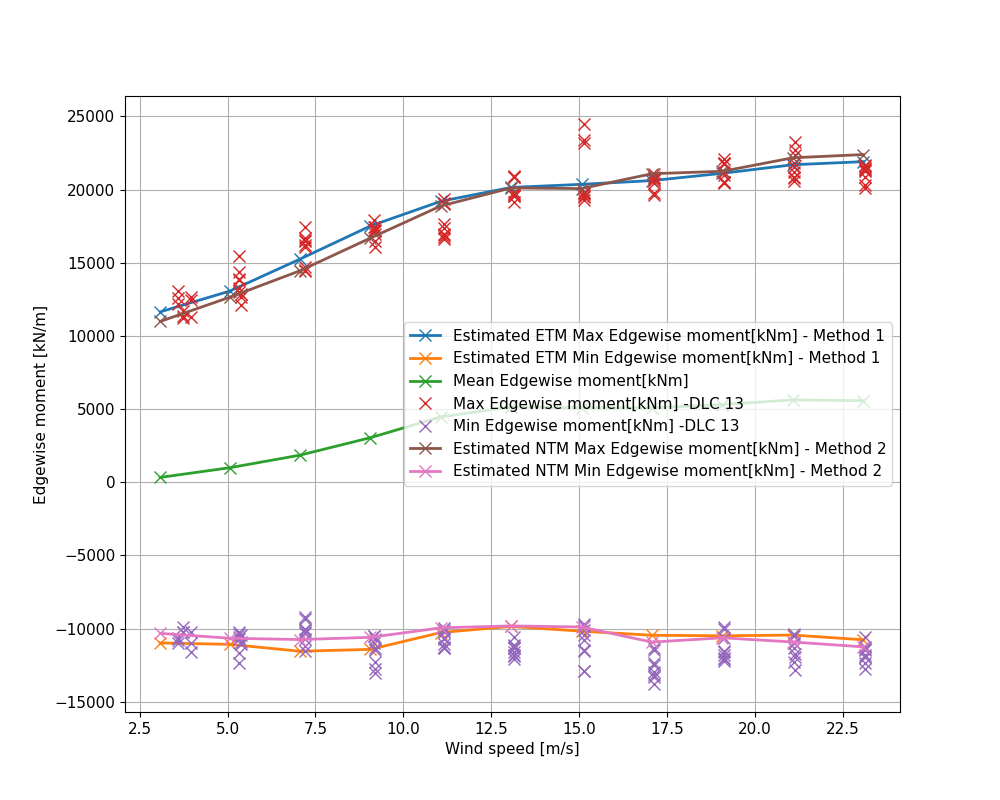
Combine steady aerodynamic loads from HAWCStab2 with simplified relationships for turbulence, rotor speed variation, and gravity. Estimate extreme flapwise and edgewise blade loads, with a later extension for flapwise fatigue loads.
Results were compared with HAWC2 simulations for two turbine models. The comparisons showed useful agreement, while identifying differences across wind speeds and methods. The tool supports early design assessment; detailed simulations remain necessary for final load verification.
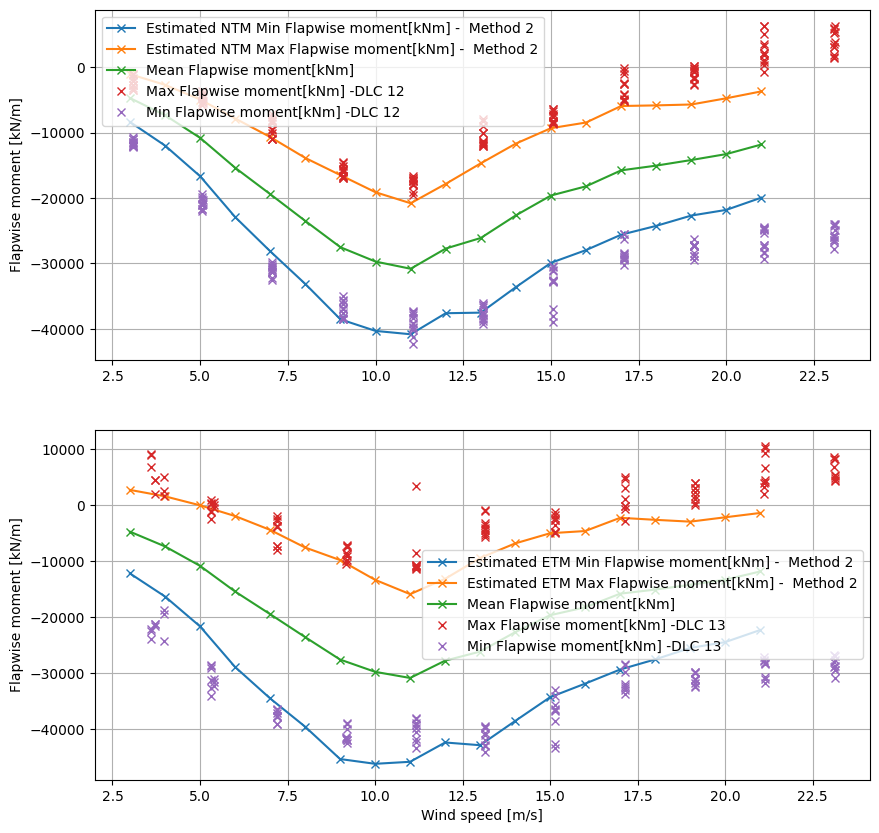
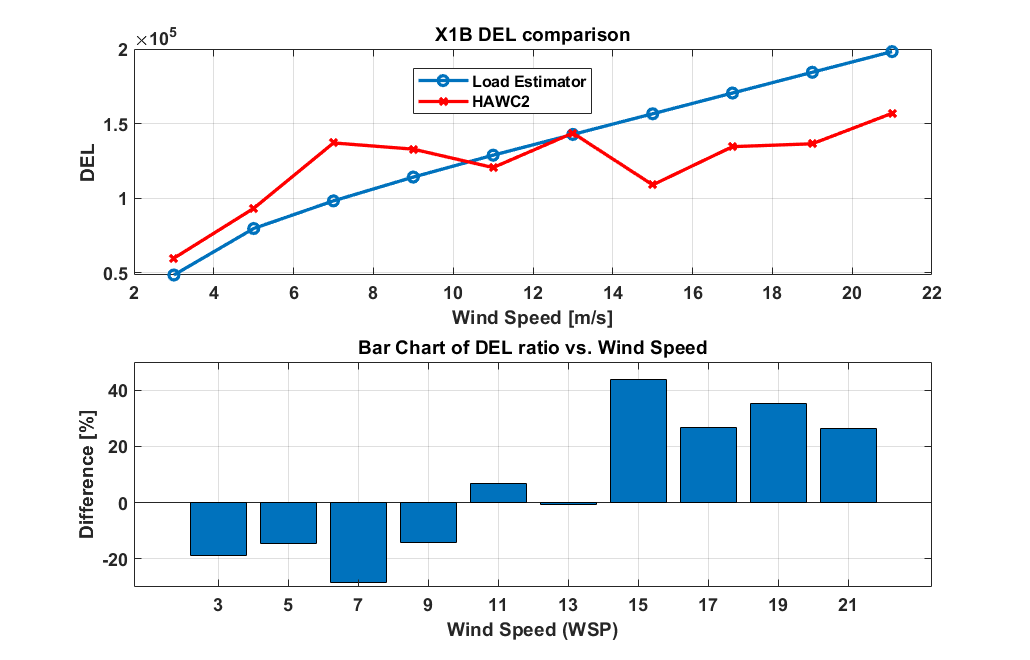
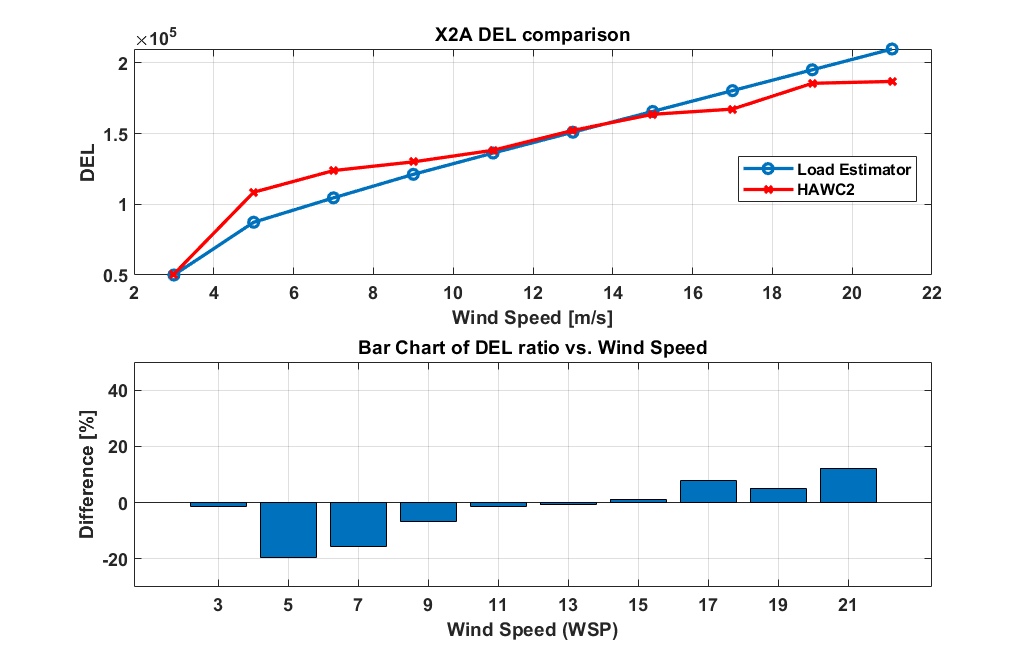
Agreement varies across wind speeds, with noticeable underestimation and overestimation in some conditions. These differences are important when assessing where the method is useful.
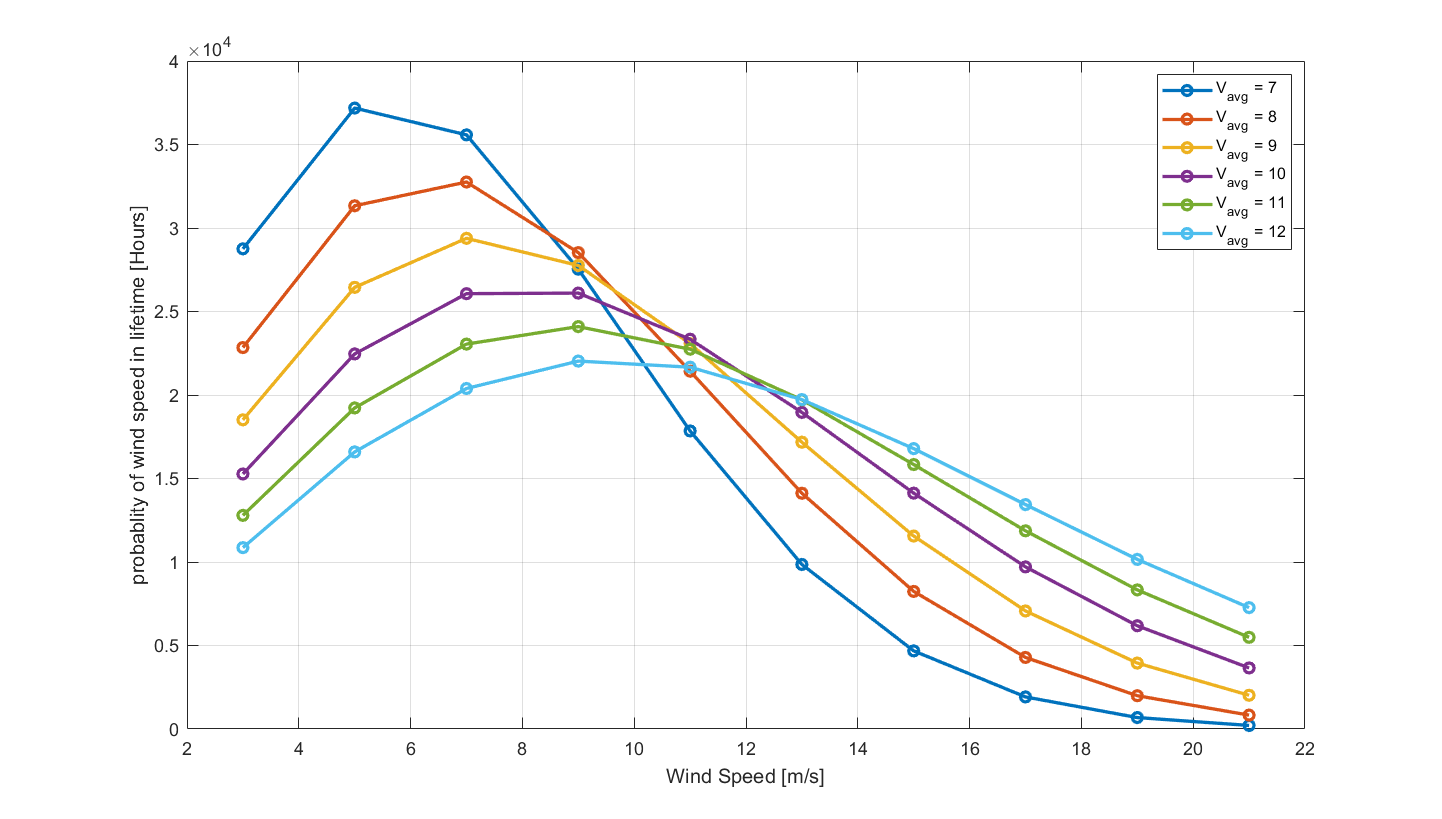
The lifetime comparison reported closer agreement with HAWC2 for the tested cases, despite larger differences at some individual wind speeds. This finding applies to the evaluated turbine models and wind distributions.
Extrapolation of wind turbine extreme loads during normal operation. A Python tool that uses simulation peaks to estimate rare loads for a chosen return period, beyond the range observed in the simulations.
Developed in Python.
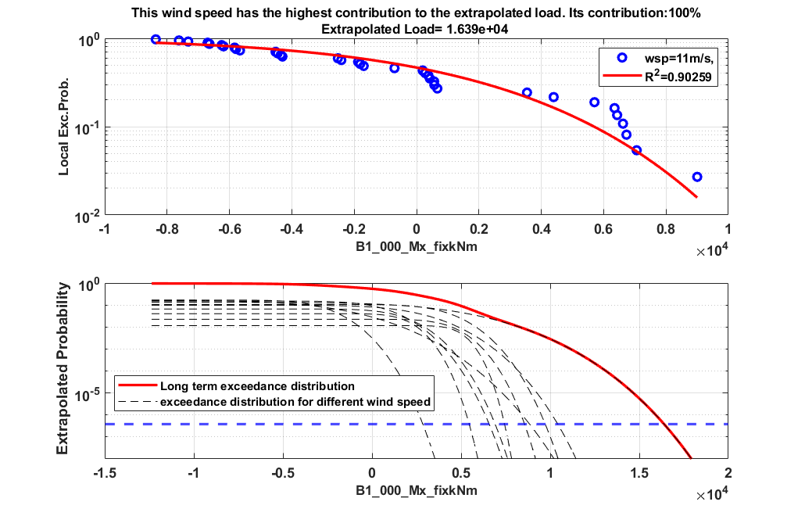
Estimate rare extreme loads during normal turbine operation using statistical extrapolation. The method extracts simulation peaks, fits load distributions at each wind speed, and combines them to estimate loads for a chosen return period.
The study evaluated the method on the DTU 10 MW and NREL 5 MW turbines and examined sensitivity to block count and turbulence assumptions. Two and three blocks gave similar extrapolated loads in the tested cases, with better distribution fits than using one global extreme per simulation. Differences varied by load channel and turbulence condition.
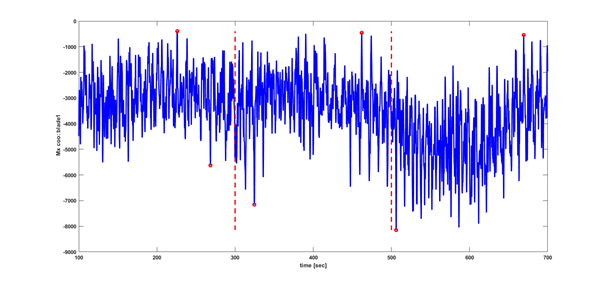
Divide each simulation time series into blocks and collect the maximum and minimum load in each block. Repeat this for the simulations and channels being analysed. The dashed red lines mark block boundaries, and the red circles mark the selected peaks.
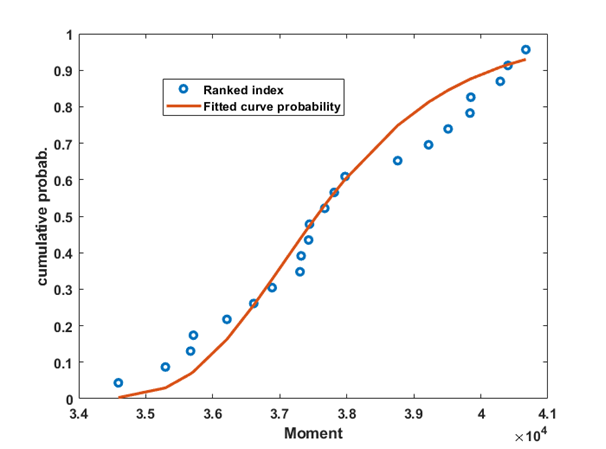
Gather and rank the peaks at each wind speed. Fit a three-parameter Weibull distribution, with shape, scale, and location parameters, using least squares. Use the fitted peak distribution and the number of peaks per simulation to calculate the short-term exceedance distribution. The blue circles show ranked peak probabilities; the orange curve shows the fitted cumulative distribution.
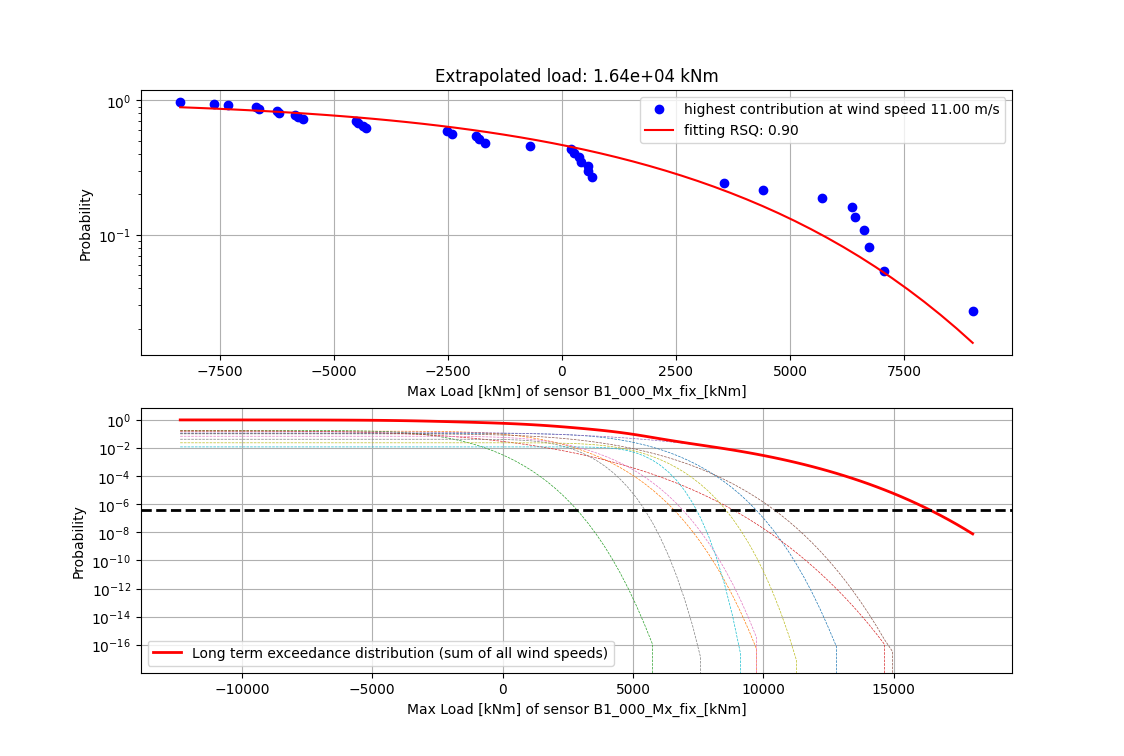
Weight the short-term exceedance distributions by the probability of each wind speed and sum them into a long-term exceedance curve. Find the load corresponding to the target exceedance probability for the chosen return period. The lower plot shows the combined curve and the dashed target-probability line.
I’m an engineer with more than 10 years of experience working with simulation and measurement data. I develop Python tools and automated workflows for analysis, model validation, visualisation, and reporting. I’m interested in roles where I can build useful software, automate analysis, and help teams work with technical data.
I’m looking for opportunities to apply my engineering, Python, and data experience.
Process wind turbine simulation results in one organised workflow.
My post-processing work was spread across separate Python scripts and different tools.
Bring data reading, calculations, and result exploration into one toolkit, with accessible Python results and a browser interface.
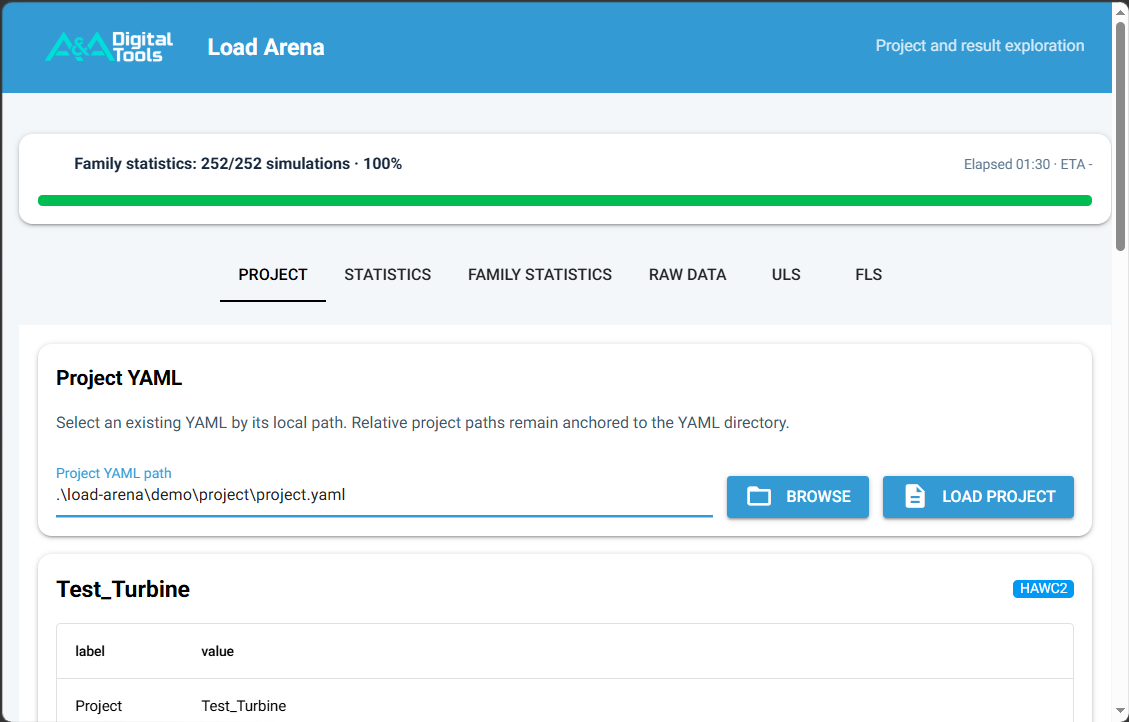
Compare load statistics across simulations to identify trends and unusual behaviour.
Results are available through the Python API and graphical interface. Pandas DataFrames support further analysis, while Parquet files store prepared results for reuse. Automated tests and continuous integration help check changes.
The project workflow supports HAWC2 simulation results. The website demo uses selected saved statistics, time series, and fatigue results.
Future features will be described separately as the tool develops.
Turn wind measurements into results you can inspect and compare.
Wind measurements span different heights, files, and instruments. Reading, combining, and comparing them requires repeated processing steps.
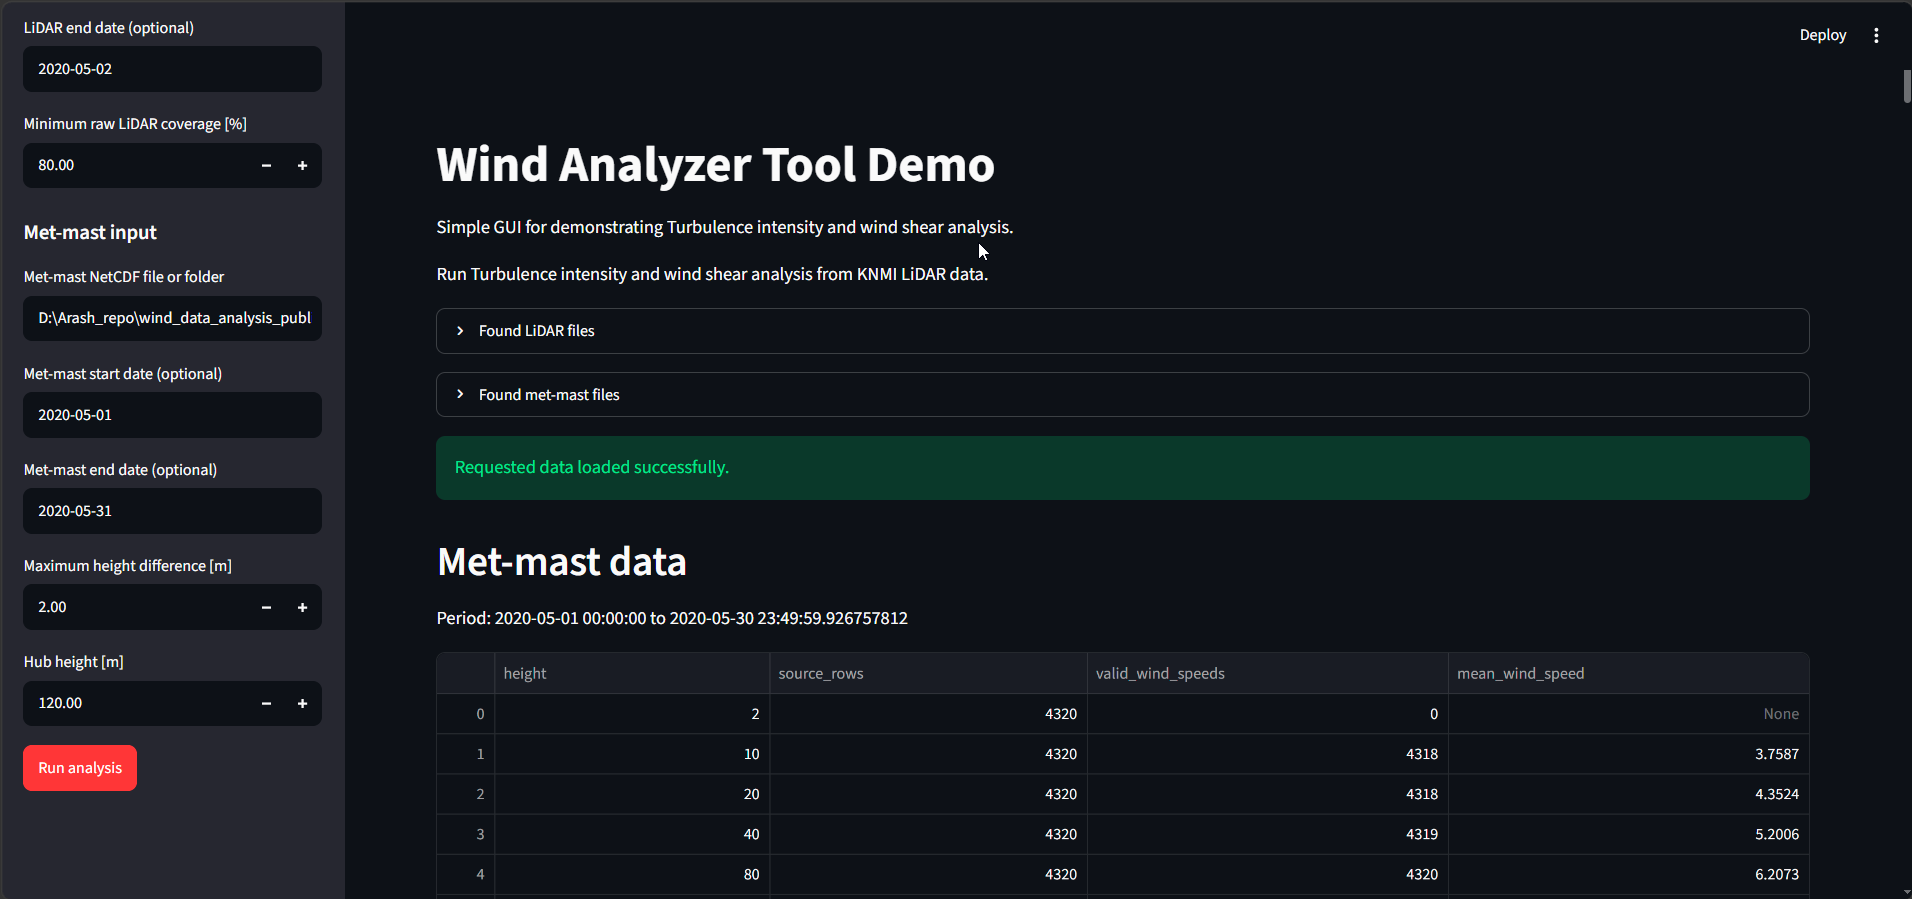
Bring file reading, ten-minute statistics, turbulence and shear calculations, instrument comparison, and result exports into a Python workflow with a Streamlit interface.
Loading prepared results…
The examples use KNMI LiDAR measurements at 11 heights from 10 to 299 m and a separate met-mast comparison at six nearby height pairs.
Wind and shear sample: 1–2 May 2020.
Instrument comparison: 7 June 2020.
The website presents saved results. Visitors can change views, select height pairs, inspect values, and zoom into the charts.
The tool remains in development. Machine learning is outside this demo.